Energy & Climate Change
Energy efficient appliances usage (EC.1)
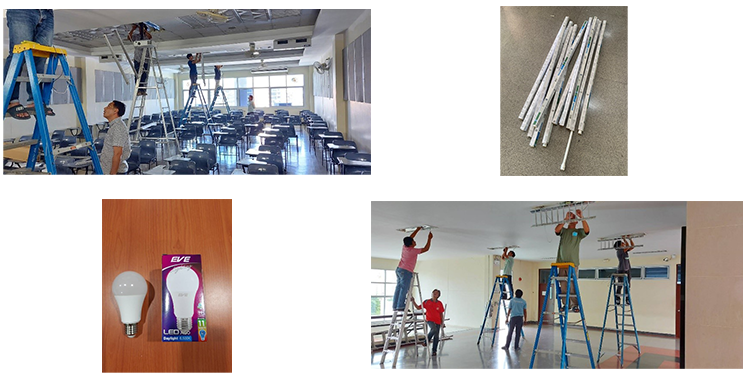
- Burapha University has promoted and supported the use of energy-saving equipment in the university, for example replacement the old light bulb of fluorescence to LED lighting in classroom and buildings of the university. Including other electrical equipment: fan, refrigerator, air conditioner. These must have an energy-saving label (Label NO.5) as specified by Electricity Generating Authority of Thailand
| Technology appliance | Total Number | Total number energy Efficient appliances | Percentage |
|---|---|---|---|
| LED Lamp | 28,135 | 21,968 | 78.08 % |
| Fan | 1,072 | 742 | 69.22 % |
| Air Conditioner | 2,251 | 1,341 | 59.57 % |
| Projector | 192 | 25 | 13.02 % |
| Refrigerator | 32 | 23 | 68.97 % |
| Average Total Percentage | 58.35 % | ||
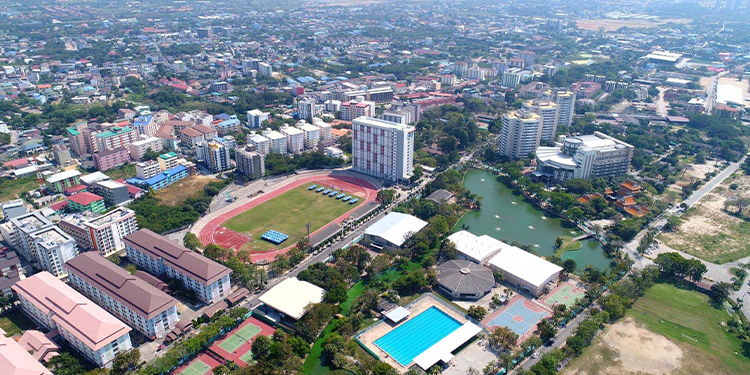
Smart building implementation(EC.2)
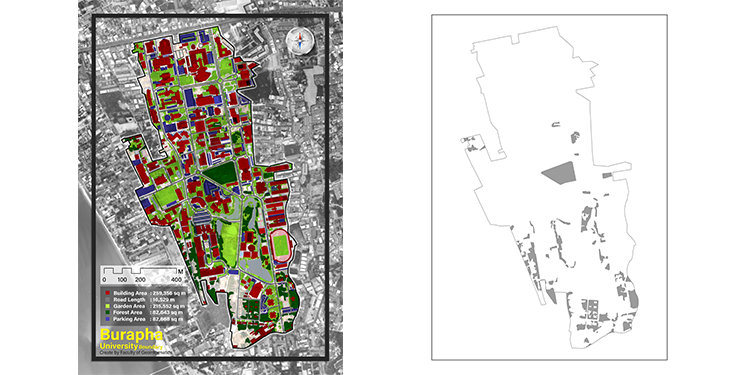
- Total area on campus covered in forest vegetation: 82643 m2The percentage of the area on campus covered in vegetation in the form of forest to the total campus area is 8.23%
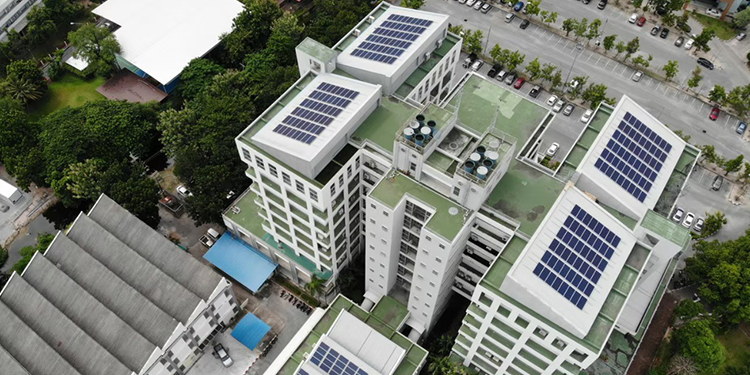
Number of renewable energy sources in campus (EC.3)
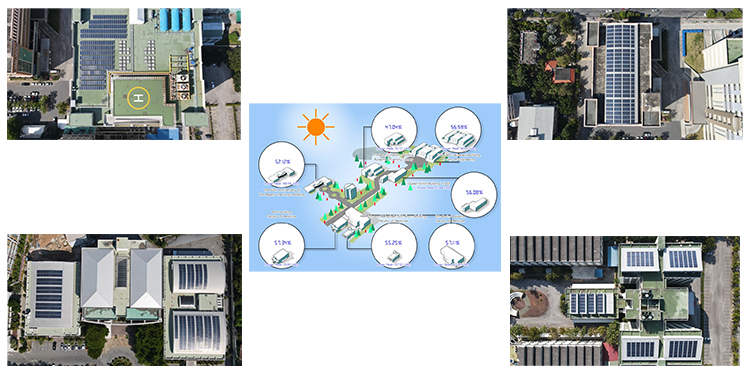
- On roofs of school building, faculty buildings of engineering and medical, library and hospitals, the solar power station of total 543.5 kWh are installed. And has installed the solar rooftop of 50 kWh on the car park roof of president office. The total capacity of renewable source is 593.5 kWh
| Building | System production (kWh)
(Sep 2020-Apr 2021) |
|---|---|
| Kasame Chatikavanij Building, Faculty of Engineering | 84,274 |
| Queen Sirikit Building 1 (QS1) | 52,267 |
| Princess Sirindhorn Building, Burapha University Library | 26,223 |
| The 60th Anniversary of His Majesty the King’s Building | 136,434 |
| BUH building, Faculty of Medicine | 66,670 |
| HRH Princess Mahachakri Sirindhorn Building, Faculty of Medicine | 91,915 |
| Srinakarind Building, Faculty of Medicine | 114,078 |
| Office of the President parking | 29,277 |
| Total | 601,138 |
The total electricity usage divided by total campus population (kWh per person) (EC.4)
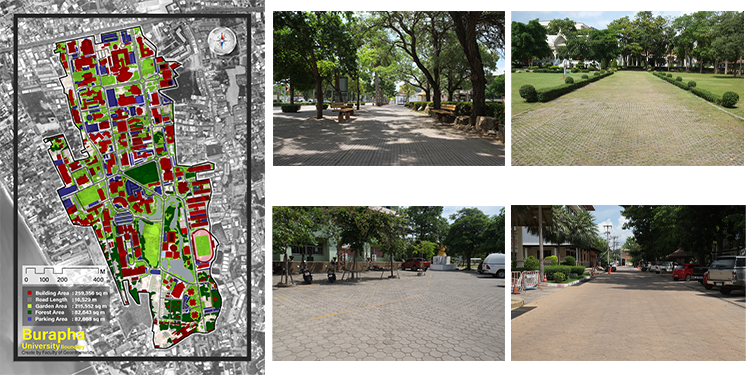
- Total area on campus for water absorption besides the forest and planted vegetation:346059 m2
The percentage of surface on campus for water absorption as a percentage to the area of campus sites = 34.46%
The ratio of renewable energy production divided by total energy usage per year (EC.5)
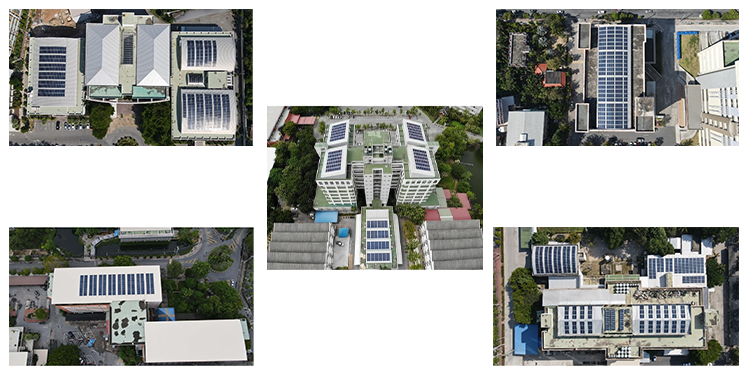
- Burapha University received a grant from the Energy Conservation and Promotion Fund Office for installing the solar power generation system on the roof (2-8 buildings) totaling 543.5 kWh which has been completed and in operation since September 2020. the solar cell system can produce electricity 694,165 units per year and reduce CO2 emissions of 667.11 tons per year. In additional, in January Burapha University has installed and activated the solar rooftop of 50 kWh on the car park roof of president office.
| Month | Electricity usage (kWh) | Renewable produce (kWh) | % Renewable to total energy usage |
|---|---|---|---|
| September 2020 | 2,581,649.22 | 8,996.00 | 0.35 % |
| October 2020 | 2,718,714.87 | 36,886.00 | 1.36 % |
| November 2020 | 2,272,082.71 | 83,224.00 | 3.66 % |
| December 2020 | 2,059,725.33 | 84,556.00 | 4.11 % |
| January 2021 | 2,145,899.05 | 93,913.30 | 6.38 % |
| February 2021 | 1,601,198.91 | 95,098.80 | 5.94 % |
| March 2021 | 2,159,863.9 | 107,087.60 | 4.96 % |
| April 2021 | 1,471,945.43 | 91,376.40 | 6.21 % |
| Total | 13,817,126.9 | 402,674.10 | 3.43 % |
| The ratio of renewable energy divided by total energy usage | 3.43 % | ||
Elements of green building implementation as reflected in all construction and renovation policies (EC.6)
- Percentage of university budget for sustainability efforts
Greenhouse gas emission reduction program (EC.7)
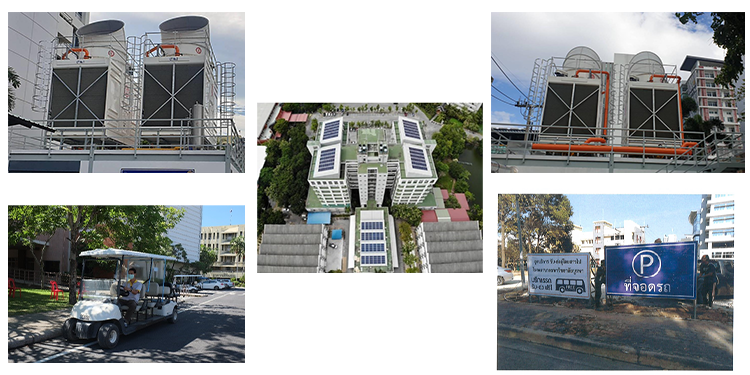
- 1. Using Solar rooftop as the renewable energy for electricity production that reducing purchased electricity, therefore can reduce CO2 emission about 345,554.94 kg. This calculated from multiplying the system's energy production with CO2 factors provided by the U.S. EPA and local standards.
2. Switching to MAGNETIC BEARING water-cooling high-efficiency chiller (Oil Free type) instead of using conventional air conditioners can reduce the energy used for cooling and does not require refrigerants that result in a greenhouse effect.
3. Service Car are available from the parking to various locations in university to reduce the carbon footprint fron private cars.
The total carbon footprint divided by total campus population (EC.8)
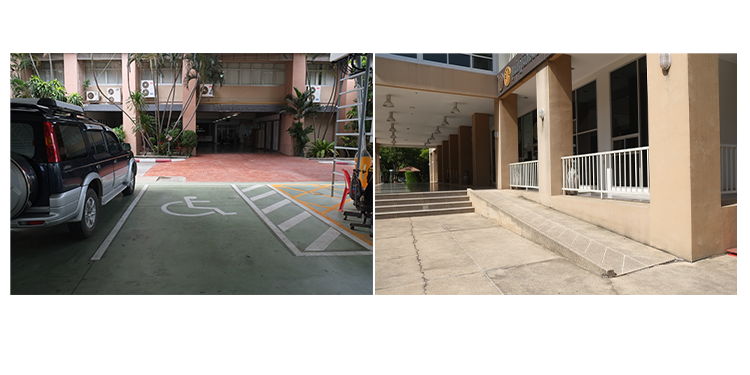
- 1. Disabled parking for disabled people to park their car which located at the nearest the entrance of the building
2. Ramp beside the building which have a suitable design for pedestrian having physical disabilities.
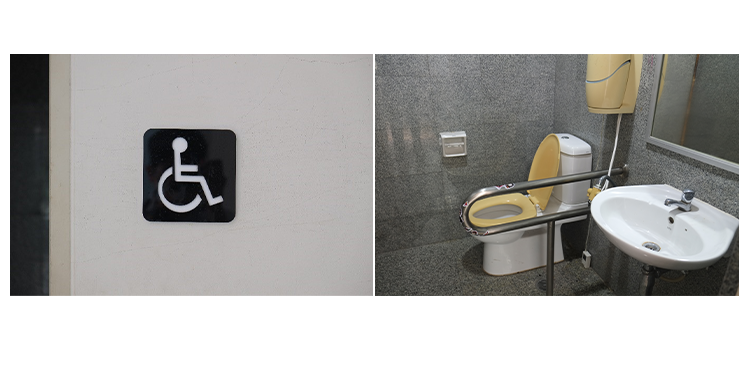
3. Accessible toilet for disabled people was installed on each floor of the building, such as visitor offices, school buildings and activity buildings. To accommodate and facilitate the disabled
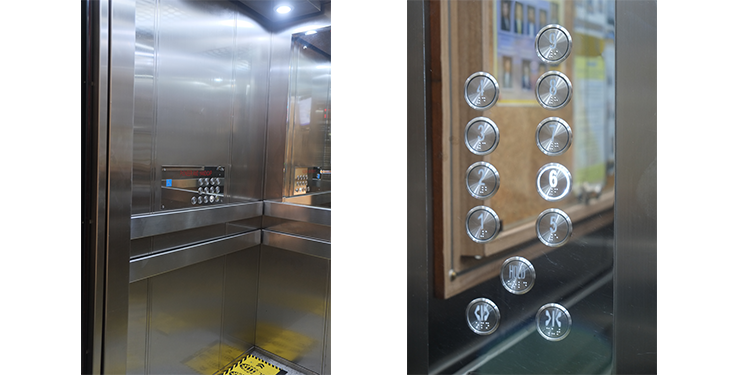
4. Elevator
Number of innovative program(s) during Covid-19 pandemic (EC.9)
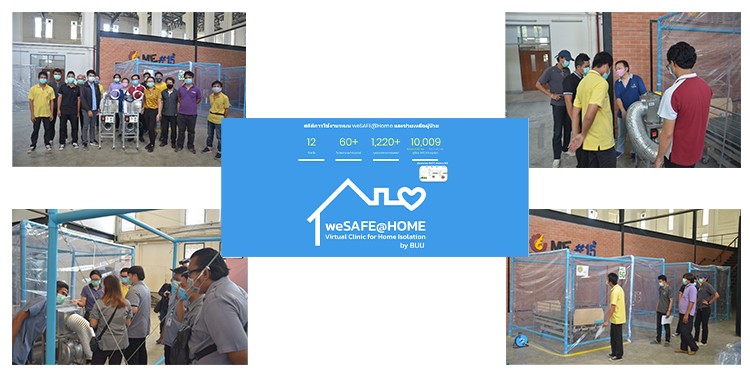
- 1.Negative pressure cabinets for COVID-19 patients is effectively prevention the spread of the COVID-19 virus for medical personnel on duty in the hospital.
2.weSAFE@HOME Virtual Clinic for Home Isolation is a system that supports home isolation measures for the green group of Covid-19 patients to self-isolate at home. The health data can be recorded from the device and report the health values to the hospital to make an appointment with a doctor to monitor symptoms. You can video call to get advice from your caregivers and transfer your health data to your family members to help monitor the patients to receive appropriate treatment as promptly and as quickly as possible
Impactful university program(s) on climate change (EC.10)
- Burapha university has Burapha university hospital as the health infrastructure facilites for university personnel and students, as well as people live in the communities surrounding the university. There are first aid, emergency room, medical personnel with medical equipment.