Transportation
Number of cars actively used and managed by University
15

Number of cars entering the university daily
1,688

Number of motorcycles entering the university daily
4.933

The total number of vehicles (cars and motorcycles) divided by total campus population (TR.1)
0.41
Shuttle services (TR.2)
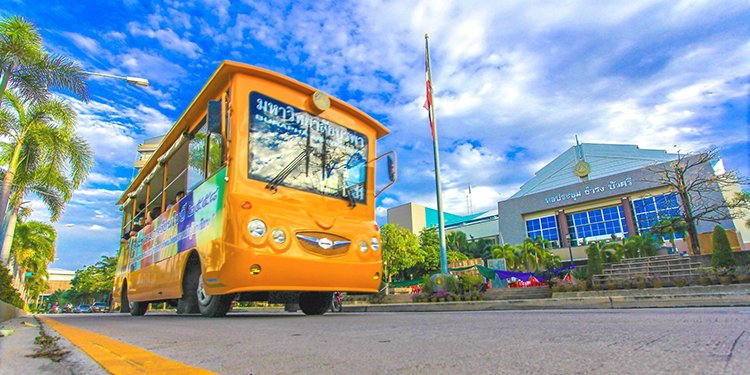
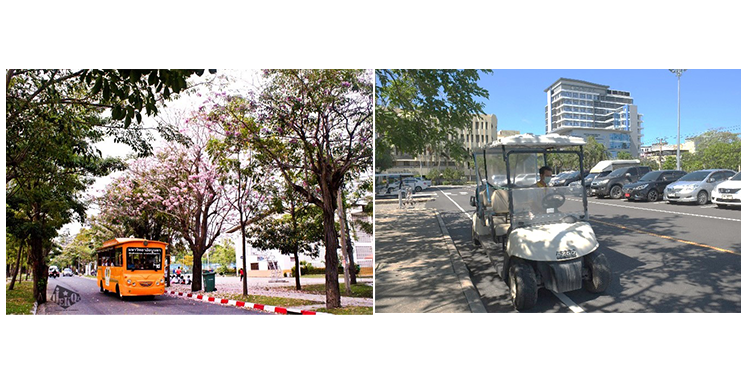
- Burapha University has provided a shuttle bus service around the university to reduce the parking space and the number of vehicles on campus. The promoting and improving the quality of the shuttle bus service as follows:
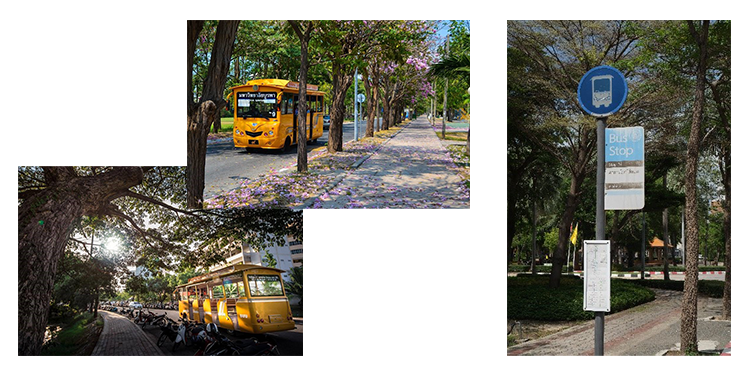
1. Develop a system to notification about the position of the shuttle bus and the time of arrival via on monitor at shuttle bus stop and BUU Transit Application for using shuttle services in Burapha university (as show below).
2. Improve the bus routes and the position of the bus stop to be appropriate.
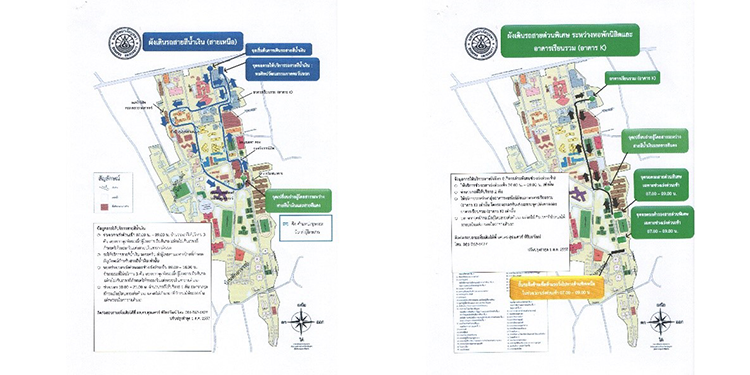
- 1. The blue line: distance 5 km/trip
2. The green line: distance 4 km/trip
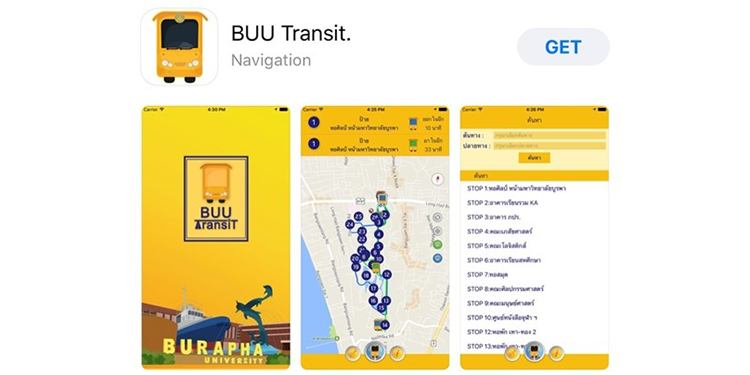
- Download
Android: BUU Transit - Google Play
iOS: BUU Transit. App Store (apple.com)

Number of shuttles operated in your university
16

Average number of passengers of each shuttle
25

Total trips of shuttle services each day
14
Zero Emission Vehicles (ZEV) policy on campus (TR.3)
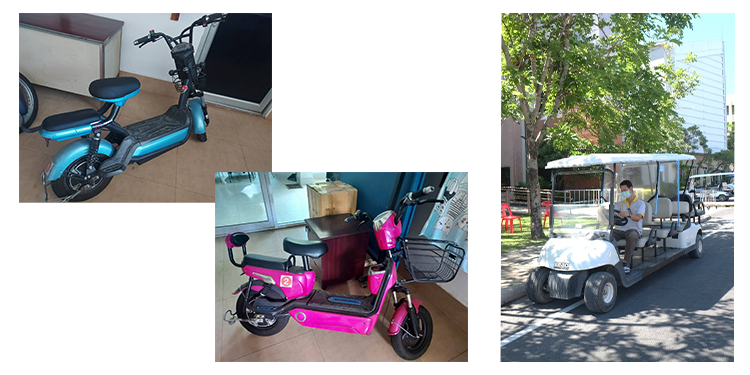
- Burapha university promotes the use of electric vehicles for both short and long trips on campus. For example, electric bicycles are used for staff for short commutes within campus and electric shuttles are used to transport people who come to the university. In addition to reducing pollution from carbon dioxide emissions, it also helps with safety and reduces accidents that occur as well.

Average number of Zero Emission Vehicles (e.g. bicycles, cano, snowboard, electric car, etc.) on campus per day
109
The total number of Zero Emission Vehicles (ZEV) divided by total campus population (TR.4)
> 0.02

Total ground parking area (m2)
82,668 m2
The ratio of the ground parking area to total campus area (TR.5)
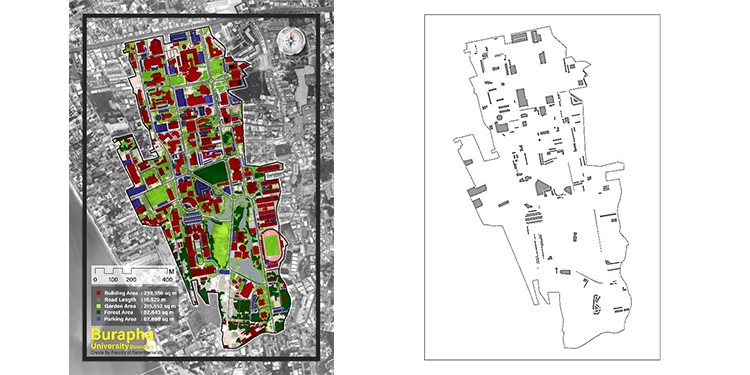
- Total campus area 1,004,278 m2
Total ground parking area 82,668m2
Ratio of the ground parking area to total campus area 0.082
Transportation program designed to limit or decrease the parking area on campus for the last 3 years (from 2018 to 2020) (TR.6)
- None
Number of transportation initiatives to decrease private vehicles on campus (TR.7)
- A number of transport initiatives to reduce private vehicles in Burapha University are
1. shuttle bus campus provide a route around the university to facilitate students, staff and people who need to travel to places or buildings in the university to reduce the use of private cars. and
2. electric service car in campus provide short distance, from the car park to Burapha University Hospital or to nearby buildings.
Pedestrian path on campus (TR.8)
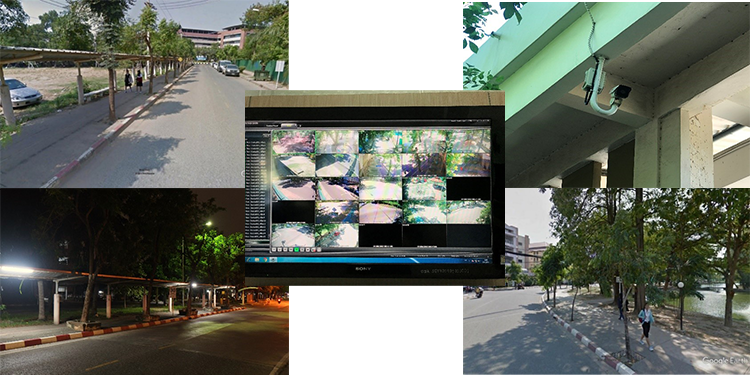
- Burapha University has a pedestrian walkway around the university, which is on both sides of the road in the university to facilitate students, staff, and other people entering the university. There is a roof to provide sun and rain for users and also secure with CCTV systems installed at various points in the university. Road lights that provide illumination at night. Raise the platform of the pedestrian higher than the pavement to separate between road for vehicle and pedestrian path. Trees are planted along the pedestrian for the shade of the walkway.